Monitoring and measuring river water quality is crucial as it provides essential data and necessary information to make decisions on water resource management.
Environmental monitoring – river mapping
River ecosystems are the flowing waters that drain the landscape, and include the biotic (living) interactions amongst plants, animals and micro-organisms, as well as abiotic (nonliving) physical and chemical interactions of its many parts.
Rivers are also commonly referred as a Source water (together with streams, lakes, reservoirs, springs, and ground water) that provide water to public drinking-water supplies and private wells.
Protecting source water makes tap water safer.
Protecting sources of water from contamination reduces the risk of unsafe levels of germs or chemicals in your water and the cost of water treatment.
Protecting water sources from contaminants—such as our waste and germs and chemicals from industrial and commercial processes—also provides additional benefits to the communities of people and wildlife that live there.
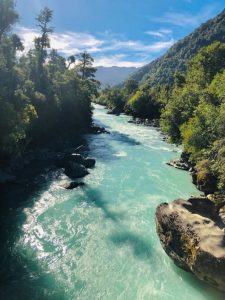

Systematic monitoring of river water quality can give us insight in changes of water and provide valuable context related of the surroundings and the effect it had on water quality.
Research monitoring may also be undertaken to ascertain the magnitude and impacts of accidental pollution events, as well as helping pinpoint the causes and likely sources of long term pollution problem.
Terrestrial life critically relies upon surface water availability for domestic use, agriculture, and industry, which are directly affected by changes in water mass exchange with the lower atmosphere.
Chemical characteristics of river water bodies originate from a variety of natural sources, including leaching of soils, weathering of minerals and atmospheric inputs.
Besides that, river pathways often cross paths with man made structures and water output which can pose a hazard to aquatic life and pollute the drinking water sources.
Regular standardized analysis of chemical parameters in water bodies allows for the early identification of existence of dangerous levels of substances that are present above their safe levels.
Monitoring can give us valuable information related to changes and trends that occurred over a certain period of time.
Locations
Selection of location and consistency in mapping can be of great value.
Locations that pose the greatest possibilities of threats should be identified and monitored on more frequent cycles.
Period
Analysis of the general physio chemical parameters are recommended to be performed on a monthly basis.
In case of suspected pollutant, additional analysis should be included.
Changes in water chemistry
With monitoring of our regional surface water, we can create better forecasts of future changes and make our planning & investments in advance.
Collected information basic guidelines:
- chemical characteristics – e.g. dissolved oxygen, pH, salinity, nutrient concentration and other contaminants
- physical characteristics – e.g. temperature, color, light, sediment suspended in the water (turbidity)
- biological characteristics – e.g. bacteria and algae.
There are several approaches to crucial water quality assessment:
- direct measurement “on the spot” with portable meters mapping can be done via GPS options
- continuous monitoring – logged at regular intervals over an extended period
- collection of water samples for laboratory analysis
pH
Unlike lakes and ponds, rivers are open systems, where frequent water exchange occurs.
One of the most devastating side effects of pollution is increased acidity in rain and groundwater. This affects animals and plants, and has long-term implications for our environment.
Testing pH levels indicates the sample acid or base properties. Rivers have some capacity to prevent changes in pH by the structure and composition of the river bed. However, drastic changes in pH can have detrimental effects on river health.
Sources of acidity and low pH level can be linked to pollution or natural factors, such as acid rain but also other external factors that can cause fluctuations in the river pH.
Some of the contributors can be agricultural runoff, acidic mine drainage (AWD), and fossil fuel emissions such as carbon dioxide, which creates a weak acid when dissolved in river water.
Dissolved Oxygen
The measured amount of dissolved oxygen is a direct indicator of water pollution.
Dissolved oxygen (DO) is the amount of oxygen available to living aquatic organisms. The amount of dissolved oxygen indicates its water quality.
Although the atmosphere is 20 percent oxygen, it has a very low solubility in water, and its solubility decreases with increasing temperature and salinity.
Oxygen will diffuse into surface waters from the atmosphere at rates of 1 to 5 mg/L daily, the primary source of oxygen in most natural water bodies is photosynthesis from phytoplankton and aquatic plants, which ranges from 5 to 20 mg/L daily.
Respiratory losses of oxygen include respiration by plankton (5 to 15 mg/L daily), respiration by fish (2 to 6 mg/L daily), respiration by benthic organisms (1 to 3 mg/L daily), and diffusion of oxygen into the air (1 to 5 mg/L daily).
Since oxygen is being produced only during the daylight hours, and respiration is occurring on a 24-hour basis, there is a diurnal (day-night) fluctuation in dissolved oxygen concentration, with minima at sunrise.
Nitrogen (Nitrate – Nitrite – Ammonia)
Nitrogen is essential to life because it is a key component of proteins and nucleic acids.
Nitrogen occurs in many forms and is continuously cycled among these forms by a variety of bacteria.
Although nitrogen is abundant in the atmosphere as a diatomic nitrogen gas (N2), it is extremely stable, and conversion to other forms requires a great deal of energy.
Historically, the biologically available forms NO3- and NH3 have often been limited; however, current anthropogenic processes, such as fertilizer production, have greatly increased the availability of nitrogen to living organisms.
The cycling of nitrogen among its many forms is a complex process that involves numerous types of bacteria and environmental conditions.
In general, the nitrogen cycle has five steps:
- Nitrogen fixation (N2 to NH3/ NH4+ or NO3–)
- Nitrification (NH3 to NO3–)
- Assimilation (Incorporation of NH3 and NO3– into biological tissues)
- Ammonification (organic nitrogen compounds to NH3)
- Denitrification(NO3– to N2)
The nitrogen cycle
Red: ammonia oxidation to nitrite (nitritation)
Reddashed: complete ammonia oxidation to nitrate (comammox)
Green: nitrite oxidation to nitrate (nitratation)
Yellow: Anammox process
Blue: denitrification
Purple: dissimilatory nitrate reduction to ammonium (DNRA)
Grey: nitrogen fixation
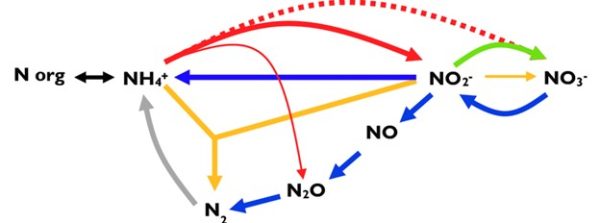

Intermediates for nitritation, comammox and anammox are not depicted.
Common Forms of Nitrogen
The most common forms of inorganic nitrogen in the environment are diatomic nitrogen gas (N2), nitrate (NO3–), nitrite (NO2–), ammonia (NH3), and ammonium (NH4+). The species that predominate depend on the chemical, physical, and biological environment.
In aquatic environments, the presence of nitrogen as unionized ammonia (NH3) or ammonium (NH4+) is dependent on the pH and temperature.
When the pH is below 8.75, NH4+ predominates. Increases in pH signify increases in the hydroxyl ion (OH–) concentration of the water, meaning the above reaction will shift to the left in order to reach equilibrium.
Above a pH of 9.75, NH3 predominates (Hem, 1985). NH3 is a more toxic to aquatic life. If biological assimilation of NH3 is not occurring at a sufficient rate, NH3 may accumulate and cause detrimental effects to aquatic life.
Monitoring nitrogen levels is necessary for many reasons, including detecting baseline nutrient levels and trends, preventing eutrophication and minimizing toxic effects of ammonia or nitrite poisoning.
Nitrite
If nitrite presence is determined in freshwater, it can pose a toxic threat to almost all living creatures. Nitrite is reactive and has an ability to oxidise Fe2+ of haemoglobin (Hb) to Fe3+. This mechanism has an impact on decreasing the oxygen-carrying capacity of blood.
First nitrite reacts with deoxyhemoglobin and a proton to form NO and methemoglobin according to Equation 1:
NO2− + HbFe+2 (deoxyhemoglobin) + H+ → NO (nitric oxide) + HbFe+3 + OH−.
The N2O3-forming reaction of nitrite and hemoglobin may regulate the export of NO from the erythrocyte.
TURBIDITY


Material suspended in the water affects light penetration and the degree to which it is blocked is referred to as turbidity. In short, turbidity is a measurement of how much suspended material is in the water and indicates water clarity.
Suspended solids can have a great effect on water bodies. They can reduce the amount of dissolved oxygen and raise surface water temperature. They can also affect fish vision, spawning, and breathing; as well as the breathing of aquatic macroinvertebrates.
In streams, increased sedimentation and siltation can occur, which can result in harm to habitat areas for fish and other aquatic life. The particles also provide attachment places for other pollutants, notably metals and bacteria. For this reason, turbidity readings can be used as an indicator of potential pollution in a water body.
The ISO standard adopted the FNU (Formazin Nephelometric Unit) while the EPA uses the NTU (Nephelometric Turbidity Unit).
HI9829
Multiparameter pH/ISE/EC/DO/Turbidity Waterproof Meter
with GPS option
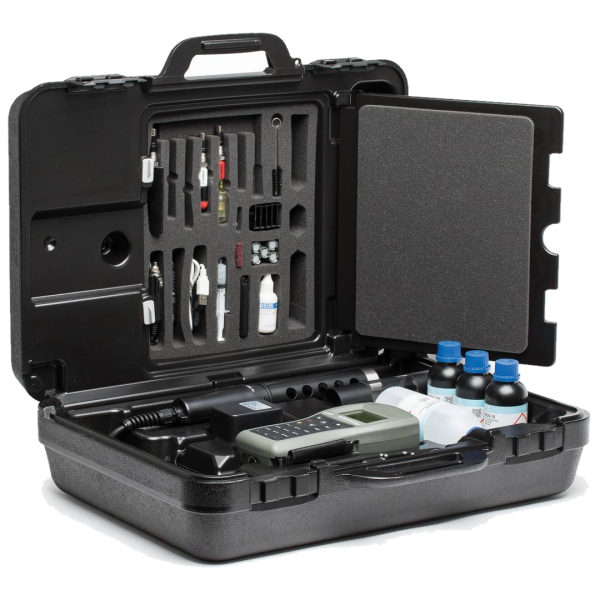
The HI9829 is a waterproof portable logging multiparameter meter that monitors up to 14 different water quality parameters.
The microprocessor based multi-sensor probe allows for the measurement of key parameters including pH, ORP, conductivity, dissolved oxygen, turbidity, ammonium, chloride, nitrate, and temperature. The probe transmits readings digitally with options to log data while disconnected from the meter.
An optional GPS provides location tracking of measurements. The complete system is simple to setup and easy to use. The HI9829 is highly customizable and supplied with all necessary accessories, packaged in a durable carrying case.
Two probes to choose from (Basic or Logging)
The HI7609829 (basic) and HI7629829 (logging) are multiparameter probes for use with the HI9829 portable meter. It is an option to choose which probe will be supplied with the HI9829.
By default, the HI9829 and corresponding probe will be supplied with a pH/ORP, conductivity and dissolved oxygen sensors. Either probe can be upgraded to measure turbidity with a turbidity/conductivity sensor.
Easy measurement of turbidity right on the spot!
Color Coded, Field Replaceable Sensors
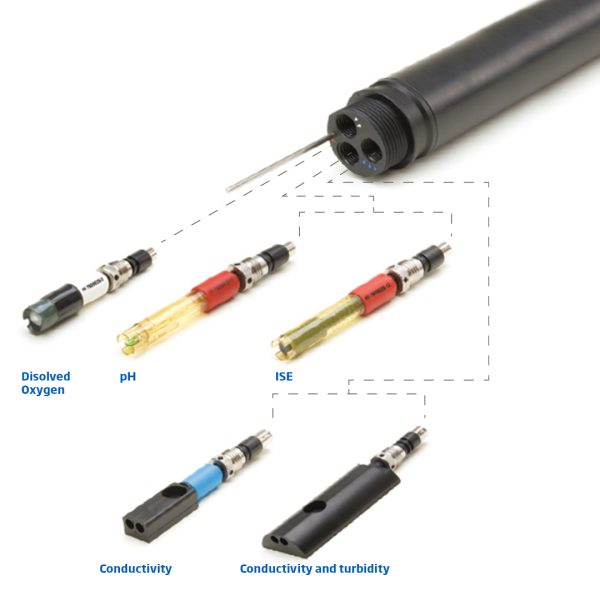

ISE
A choice of three ion selective electrodes (ISE) is available for constant reporting of common surface water contaminants. Nitrate, ammonium and chloride ISEs are available.
- HI7609829-10 Ammonium ISE
- HI7609829-11 Chloride ISE
- HI7609829-12 Nitrate ISE
Samples collected through location points can be easily analyzed on a spectrophotometer for a variety of crucial parameters such as:
- Alkalinity
- Ammonia
- Calcium
- Free Chlorine
- Total Chlorine
- Chemical Oxygen Demand (COD)
- Copper
- Total Hardness
- Iron
- Nitrate
- Nitrite
- Total Nitrogen
- Dissolved Oxygen
- Phosphate
- Reactive Phosphorus
- Surfactants Anionic
mag.ing.chem.ing
Have questions?
Contact a Hanna Technical Specialist at info@hannaservice.eu or using our contact form.
SOURCES:
APHA AWWA, WPCF, 1998. Standard methods for the examination of water and wastewater 20th edition. American Public Health Association, American Water Work Association, Water Environment Federation, Washington, DC.
https://apps.who.int/iris/bitstream/handle/10665/43428/9241546964_eng.pdf?sequence=1&isAllowed=y
https://pubs.usgs.gov/wsp/wsp2254/pdf/wsp2254a.pdf
https://www.epa.gov/national-aquatic-resource-surveys/indicators-dissolved-oxygen
https://extension.usu.edu/waterquality/learnaboutsurfacewater/propertiesofwater/turbidity
https://www.sciencedirect.com/topics/earth-and-planetary-sciences/dissolved-oxygen


